Skip to content

Reporting and analysis

From feedback to clarity in a heartbeat.

Real-time dashboards bring together every activity, giving your team immediate visibility into what customers think and why.
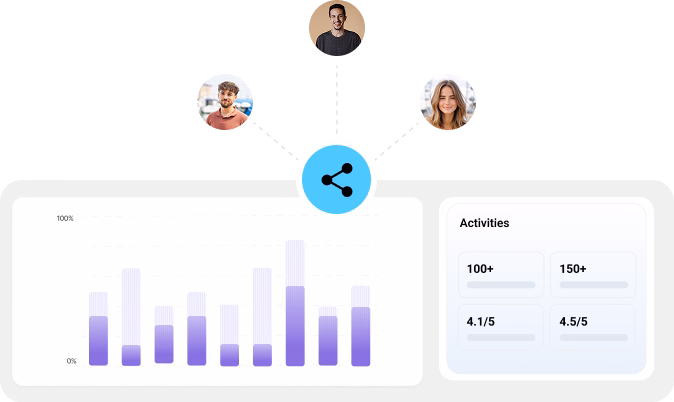
Reporting and analysis UI screenshot
Dashboards screenshot

Realtime dashboards

See all ongoing activities, participation rates, and outcomes in one place. Instantly access visual dashboards or download detailed data for deeper analyses.

Segmentation views

Filter results by the features that matter to you — persona, country, customer group, or any custom segment — for sharper, more targeted decisions.

Segmentation reporting screenshot
Combine qual and quant screenshot

Combine qual and quant

See comments and metrics side by side for context that numbers alone can’t give.

See reporting and analysis tools in action


Frequently asked reporting and analysis questions 

Everything you need to know about reporting and analysis on Leanlab.

The dashboards show all ongoing activities, including participation rates and outcomes in one place. You can also access visual dashboards instantly or download detailed data for deeper analysis.

Yes. You can download detailed data to do deeper analysis outside the visual dashboards when needed.

This matches common research ops practice: export data when you need deeper slicing, custom statistics, or internal reporting formats.

Segmentation views let you filter results by the dimensions that matter: examples include persona, country, customer group, or any custom segment, to support more targeted decisions.

It means seeing comments (qualitative) and metrics (quantitative) side by side, so you don’t just know what happened, but also why.

This aligns with mixed-methods UX research, where qual + quant are intentionally integrated to answer the same overarching question more completely.

In Leanlab, AI‑assisted analysis features are connected to the AI Research Advisor and designed to speed up reporting and analysis.

When your team is already collecting frequent feedback, AI support reduces your time spent synthesizing results and helps you move more quickly from raw responses to clear insights and actions.

The positioning is “in a heartbeat” via real-time dashboards: i.e., immediate visibility rather than waiting for manual reporting cycles.

A common pattern is: run multiple activities in parallel, then use dashboards to monitor participation rates/outcomes, and segment views to compare signals across personas/countries/customer groups. Decisions can be made faster and with more confidence.

AI Assisted Analysis Features

Speed up your analysis with our AI Research Advisor

Ai reporting highlight-1

“I only need to sit down for a maximum of one day and put together a task for the community. And we have the answers the next day, or sometimes even the same day“

Niknaz Moslehi

UX Designer, Lindex

Lindex Case highlight